
live · Platform · HOLOIN OS
For the person who has to run all of it, and the IT team that has to keep it running.
One platform. This much of it, today.
Six kinds of asset today, one more in development, one product: every device lands on one pipeline, belongs to one place, is judged by rules you can read, and ends up as one list of what needs a person. On servers you own.
- MQTT
- HTTP
- Monitoring-tool alerts
- LoRaWAN sensors
- CoAP
- NB-IoT (LwM2M)
- OCPP
- Sparkplug B
- Cellular trackers
- BACnet
- Modbus
- OPC UA
- KNXbeta
- SNMP
- SunSpec
- MTConnect · PLC links
- The web appoperators, managers, IT
- The phone appdrivers, technicians, managers
- Vehicles, drivers, yardsFleet
- Farms, fields, zonesAgriculture
- Buildings, floors, rooms, racksBuildings
- Sites and regionsRemote sites
- Plants and arraysEnergy
- Depots and chargersEV charging
- Machines and linesSmart factory
- Webhook receivers
- ERP · CRM · ticket tool
- Your monitoring
The stack, as it runs. What comes in on the left, by protocol; one server in the middle, yours — the web entry, the bundled servers, the modules on one contract, HOLOIN OS and your data; what it serves on the right. The locks are where they sit: at the door, in the log, on the data, on the boundary, on our own access. On a server we run for you, our access to your data is off by default: your administrator grants it, for a set time, and every action is logged against both identities.
Device to decision, in six steps.
Every box is a part of the product; nothing in this picture is a plan. Readings move left to right; what a person decides moves back.
Every protocol lands on one pipeline.
A tracker's fix, a LoRaWAN uplink, a BACnet point, a charger's meter value and a JSON push all become the same thing: a packet, stored first, then decoded by the measurements the device's product declares. The pipeline is the same code for all of them. Adding a protocol is a driver or a parser, never a change to the path a reading takes — which is why every kind of asset shares one product.
Each protocol appears here only when its acceptance run passed; the list is generated from the facts file, not typed.
One device, one place. The place is the record.
Every kind of place, one contract.
A vertical is a module that tells the platform what its places are, which device roles they take and what to show. The twin itself is the platform's: readings judged against each measurement's lines, status rolled up to the floor, the field, the region; live updates pushed over a socket; history by the minute, hour or day. What isn't measured is shown as unknown, never as zero.
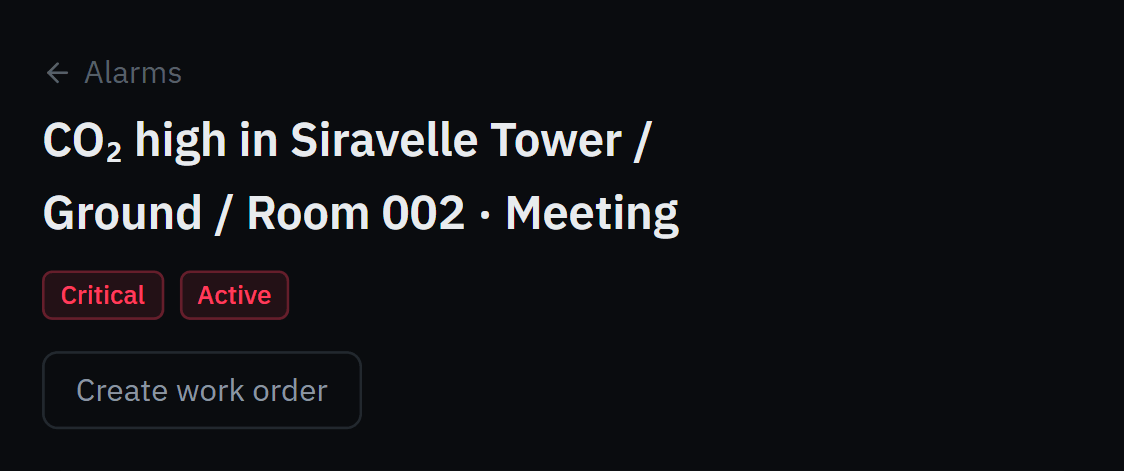
From the demo run. Room 002's twin, the reading judged against its line, the device placed in one room, the update pushed as it arrived.
Automation you can read. Commands you can prove.
A rule is a sentence, and the builder shows it as one.
When a reading arrives, a position changes, a schedule ticks or an event fires; if a condition holds (a threshold, a state change, a time window, a module's own check); then alarm, notify, open a work order, send a command. Shipped templates give most modules a start; a rule on readings can be tested against the last 24 hours (up to 7 days) without writing anything. Escalation is the rule's; quiet hours, the rule's or the person's, hold back email only.
The shipped rule. The CO₂ template as the builder shows it.
"Sent" is not "done".
A command to a device is refused with a reason when a rule, a lock or a read-only setting says so, and otherwise sent through the device's own server. It completes only when a later reading from the device proves it — a valve reporting open, a generator reporting running, a charger's meter under its limit. No proof in time is a failure, never a quiet success. Every outcome is logged.
From the demo run. A start counted only when the controller reported it running.
Arithmetic you can read. No model.
The twin remembers what each measurement usually does, notices what tends to follow what, and proposes. What it proposes comes as a recommendation with its evidence and an expiry; nothing learned acts on a device.
Usual for this hour of the week
Its hour-of-week usual over the last 28 days, shown from the second week; beside every number as "usual for Tuesday 10:00", with the spread.
Trends, and when a line is reached
A date "at this rate" only when the fit is good and the line moves the wrong way; otherwise nothing.
Dependencies it noticed
Proposed when one event follows another often enough to be unlikely by chance; a person confirms it, and it never alarms by itself.
"What if this fails"
A scenario walks the wiring and what the twin has seen, in order, with how sure it is; the one way out is a work order a person opens.
Lifetime
A maker's rating where a datasheet gives one, wear from its own trend, duty counted from its own readings — never averaged into one number; the earliest date shows, naming its source.
Rules proposed from your own failures
A line that would have caught past failures, with how many and how early; confirming it makes an ordinary rule.
Each item is marked live only once a release's acceptance run has proved it; the ledger below shows the state today.
Your other systems subscribe. HOLOIN stays the record.
In
- Sourcesa token per source: HTTP push, MQTT publish, the bundled servers, a monitoring tool's alerts
- Field mapsplace any JSON by path, preview on a pasted sample, replay what couldn't be placed
- Your asset databaseread, diffed, applied after review; never written to
Out
- Events, signeda subscription per receiver; every delivery signed, retried on a schedule, then marked dead — every delivery replayable
- The API, documentedkeys with scopes you choose; the OpenAPI document published with each release, served by the install when switched on
- Reportswhere a module has them, as a table or a CSV, every run logged
An ERP, a CRM or a ticket tool takes HOLOIN's events and reads its API the same way a webhook receiver does; no ERP, CRM or ticket tool has a connector of its own, and none is claimed here.
Built to be run by your IT team.
One bundle, one script
Images, compose file, installer and guide in one archive; ready in 2 min 42 s on the acceptance box (run 39194860273). No internet needed to install; the radio servers are profiles you choose at install.
Backups that are tested
Nightly, with a monthly restore drill; a failed backup or drill is an alarm in the product. A restore is proven on every release.
Sign-in your way
Single sign-on through your identity provider; two-step sign-in with codes; roles as named sets of permissions, the same vocabulary as API keys.
Support access with consent
Our access to your data is off by default: your administrator grants it, for a set time, and every action is logged against both identities.
An audit log that can't be edited
Every change, by whom, from where; append-only in the database itself, kept at least seven years, never less, even from its own administrator. A driver's data exported or erased, a user's erased, on request.
Watched like any service
Health and readiness endpoints, metrics for your monitoring, structured logs with no personal data, a support bundle your IT team can read before it leaves.
One server. Everything inside it.
HOLOIN installs on one Linux server with Docker, in your datacentre or on one we run for you in the country you choose. The database, the app (with its charger and MQTT endpoints), the radio servers — profiles you choose at install — the web entry and the backups are containers in one compose file; the Field Agent usually runs on your OT network, because that is where the controllers are, and it only ever connects outward.
What that buys you is boring on purpose: no cloud account, no managed service, no part of the product that needs the internet to work. What it doesn't buy yet is said plainly below.
What we have measured.
Only numbers from runs, with the conditions they ran under. On a 2 vCPU / 8 GB cloud runner, one server kept up with 33.3 packets/s — 500 trackers reporting every 15 seconds, processed within 1.5 seconds (p99) — and fell behind at 42 packets/s. When the load stopped, every packet accepted was processed; none was refused.
500 trackers in 500 vehicles, 20 geofences, through the proxy over TLS — every packet through decoding, positions, geofences and rules; each rate held for 5 minutes (the first for 3). Hardware: a 2 vCPU / 8 GB cloud runner; run 36822098734 on commit cbb4e63, 2026-10-01. CPU is the app / database share of one core.
| Each tracker reports every | Rate | Kept up | Receipt → fully processed | Dashboard reads, p95 | CPU |
|---|---|---|---|---|---|
| 30 s | 17 packets/s | yes | p50 44 ms · p95 121 ms · p99 191 ms | 90 ms | 33 % / 31 % |
| 20 s | 25 packets/s | yes | p50 58 ms · p95 212 ms · p99 1.1 s | 131 ms | 53 % / 52 % |
| 15 s | 33.3 packets/s | yes | p50 140 ms · p95 718 ms · p99 1.5 s | 243 ms | 72 % / 76 % |
| 12 s | 42 packets/s | no — 489 waiting at the end | p50 17 s · p95 24 s · p99 27 s | 3.9 s | 91 % / 86 % |
| 10 s | 50 packets/s | no — 3,456 waiting at the end | p50 54 s · p95 83 s · p99 85 s | 4.1 s | 90 % / 87 % |
After the last stage, the queue drained to zero in 63 seconds: all 48,000 packets were accepted and processed, none refused. Storage: ≈ 2 KB of database per packet (99 MiB for 48,000 packets). The install guide sizes installations at 25 packets/s, below the measured ceiling. In tracker terms — arithmetic, not measured, since 500 devices were tested: 33.3 packets/s is about 1,000 trackers reporting every 30 s; the 25 packets/s planning figure about 750.
| Measured | Result | Conditions |
|---|---|---|
| Packet-to-screen latency | median 56 ms · p95 92 ms · max 183 ms | From the ingest request to the update arriving on the web app’s live channel; one tracker, one packet a second, 300 packets, none lost — on one laptop (16 GB RAM), the demo installation, otherwise idle. |
Load results above this are published as we measure them.
Everything in the product, by layer, as the product reports it.
How readings arrive
The twin
Rules and actions
What it learns
Running it
The protocols and the kinds of asset come from the product's own report of itself: what a release lists, this page lists. The rest is traced to the product's code, and each item links to what shows it. An item marked in development is not yet live: it is being built, or built and not yet through the run that marks it live.
See it running on your kind of asset.
I run the assets
Fifteen minutes on your kind of asset — a truck, a room, a site, a plant, a depot — and the one list behind all of them. Your devices if you bring their maps.
I run the servers
The install guide and the API reference are public. Read them before we talk.
Read the install guide →